Beyond ticket sales, CloudJoi’s Insights tab gives you a broader view of how your event is performing in terms of marketing, sales velocity, and audience satisfaction. It’s designed to help you optimise your event visibility and ticket conversions.
📍 Where to Find It
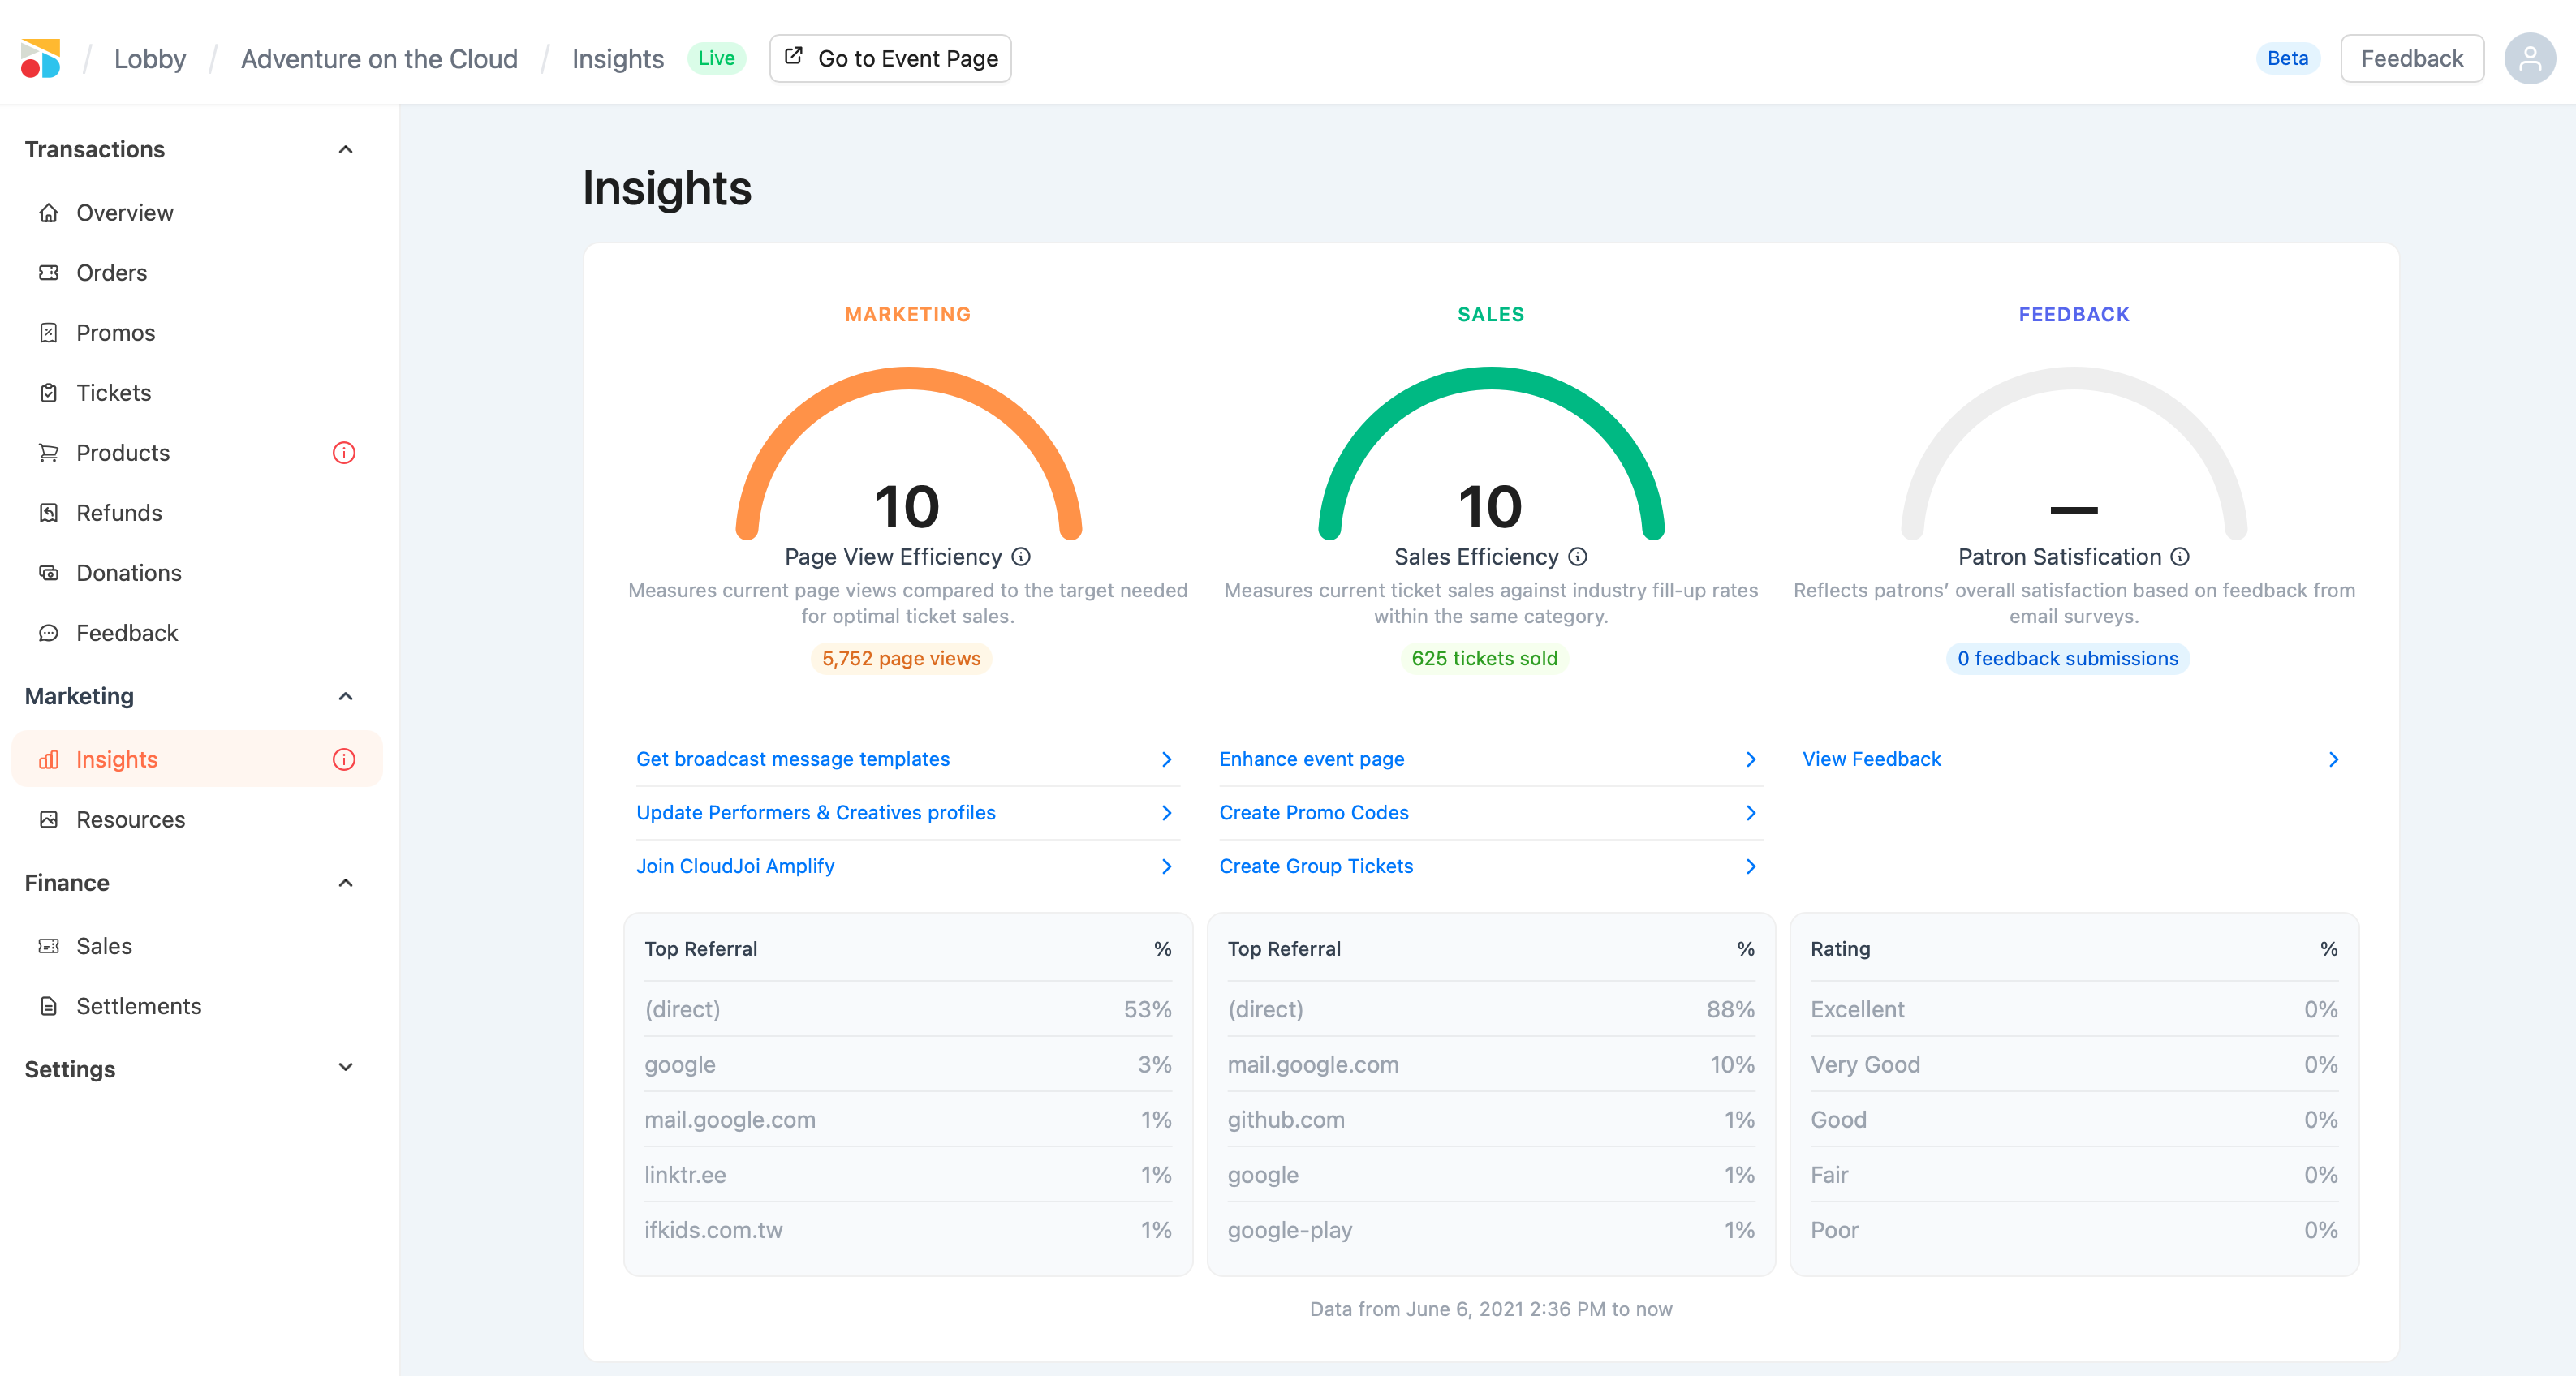
Go to your event → Insights under the Marketing section in the sidebar.
📊 What’s Included
🟠 Page View Efficiency
Shows how many views your event has received and whether it meets expected engagement benchmarks.
- Benchmark is based on industry category & past organiser data
🟢 Sales Efficiency
Compares your current ticket sales to average fill-up rates within your category.
- Based on CloudJoi-wide data for similar events
🟣 Patron Satisfaction
Collects post-show feedback submitted by patrons via email surveys.
- View average ratings and qualitative responses
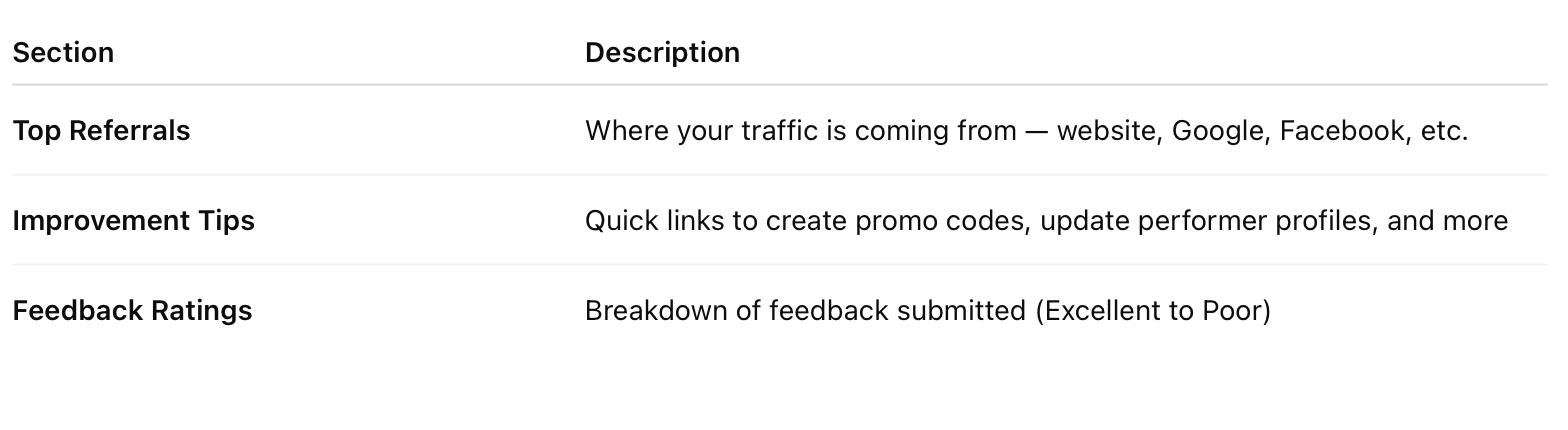
📈 Additional Metrics & Tools
🧠 Why It Matters
-
Catch slow sales early
-
See if your marketing is reaching the right people
-
Understand what’s working — and where to improve